

Image Details
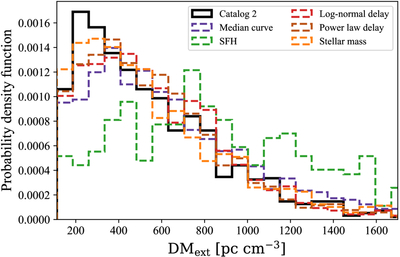
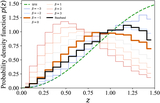
Caption: Figure 6.
DMext distribution. The same color scheme is used as in Figure 3, except that the CHIME Catalog 2 DMext distribution is shown by the solid black histogram. For each detectable synthetic event, DMext is assigned using DMext(z) distribution, and the same DMext selection in Section 2.1 is applied. The horizontal axis is linear, whereas K. Shin et al. (2023) and CHIME/FRB Collaboration et al. (2026) use a logarithmic axis. Probability densities in the two coordinates are related by ﹩p(x)=p(\mathrm{log}x)/x﹩. We use a linear axis because DMext is approximately a linear proxy for redshift.
Other Images in This Article
Copyright and Terms & Conditions
© 2026. The Author(s). Published by the American Astronomical Society.

Copyright ©
2026 Astronomy Image Explorer. All Rights Reserved.
