

Image Details
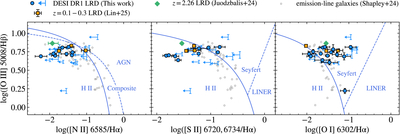
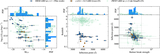
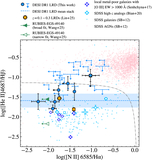
Caption: Figure 9.
BPT diagram for the narrow emission lines in LRDs. DESI DR1 LRDs are shown in blue. The z < 0.3 LRDs from Paper I are shown as orange squares, and the z = 2.26 LRD from I. Juodžbalis et al. (2024) is shown with a green diamond. The emission-line galaxies at z = 1.4–7.5 from A. E. Shapley et al. (2025) are shown with gray circles. The classification boundaries for different ionization mechanisms (G. Kauffmann et al. 2003; L. J. Kewley et al. 2006) are shown as blue solid and dashed lines. The corresponding regions are labeled.
Other Images in This Article
Show More
Copyright and Terms & Conditions
© 2026. The Author(s). Published by the American Astronomical Society.

Copyright ©
2026 Astronomy Image Explorer. All Rights Reserved.
