

Image Details
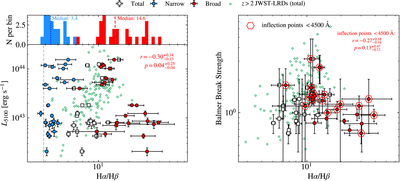
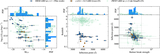
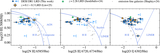
Caption: Figure 6.
Left: Balmer decrement of the broad and narrow components vs. L5100. Total (broad+narrow), broad, and narrow Hα/Hβ are shown as white squares, red circles, and blue circles, respectively. The total Hα/Hβ of z > 2 LRDs from A. de Graaff et al. (2025a) is shown with green diamonds. The top panel shows the narrow-line Hα/Hβ distribution in blue and the broad-line distribution in red, with median values labeled. Right: Balmer decrement vs. Balmer break strength. A subset of the DESI DR1 LRDs with inflection points blueward of 4500 Å is marked with the red hexagons.
Other Images in This Article
Show More
Copyright and Terms & Conditions
© 2026. The Author(s). Published by the American Astronomical Society.

Copyright ©
2026 Astronomy Image Explorer. All Rights Reserved.
