

Image Details
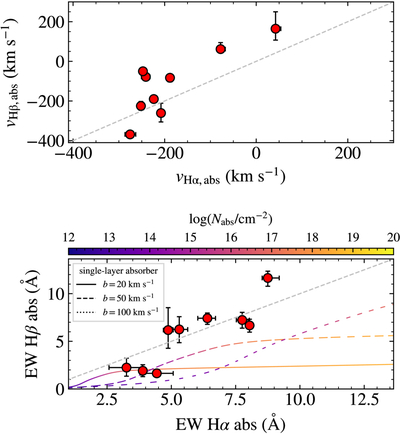
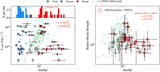
Caption: Figure 7.
Velocity shifts and EWs of Hα and Hβ absorption for sources in which both absorbers are detected. The gray dashed line indicates the one-to-one relation. In the bottom panel, the color-coded curves show the expected EWs of Hα and Hβ as a function of ﹩\mathrm{log}N﹩ and b, assuming one gas cloud produces both transitions.
Other Images in This Article
Show More
Copyright and Terms & Conditions
© 2026. The Author(s). Published by the American Astronomical Society.

Copyright ©
2026 Astronomy Image Explorer. All Rights Reserved.
