

Image Details
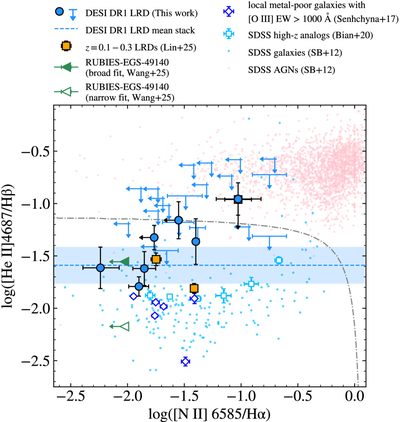
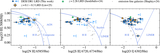
Caption: Figure 10.
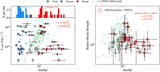
He II 4687/Hβ vs. [N II] 6585/Hα for LRDs over a wide range of redshifts. The DESI sample in this work is shown as blue circles and triangles, where the latter denote sources for which only upper limits are available for both line ratios. The mean stacked He II/Hβ ratio of the DESI LRDs is shown as a blue dashed horizontal line, with the shaded region as the associated uncertainty. Local LRDs at z = 0.1–0.3 from Paper I are shown as orange squares. He II emission in JWST-discovered LRD RUBIES-EGS-49140 (B. Wang et al. 2025) is shown as a filled green triangle when measured with a narrow+broad profile, and as an unfilled green triangle when measured with only a narrow Gaussian. We also include SDSS-selected galaxies (light-blue circles) and AGNs (pink circles) compiled by M. Shirazi & J. Brinchmann (2012), as well as high-z galaxy analogs (light-blue squares) from F. Bian et al. (2020) and extremely metal-poor galaxies with [O III] λ5008 EW > 1000 Å (blue diamonds) from P. Senchyna et al. (2017). The dashed–dotted line marks the theoretical maximum starburst line from M. Shirazi & J. Brinchmann (2012).
Other Images in This Article
Show More
Copyright and Terms & Conditions
© 2026. The Author(s). Published by the American Astronomical Society.

