

Image Details
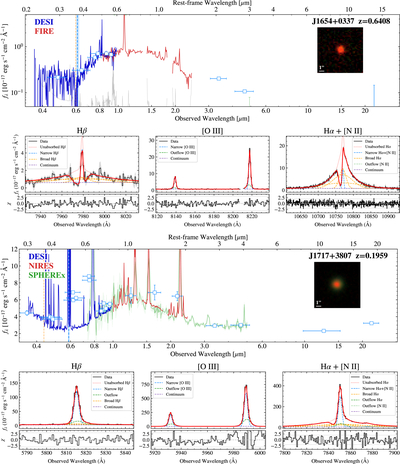
Caption: Figure 2.
Example DESI DR1 LRDs presented in this work. The top panel shows the overall SEDs, with the smoothed DESI spectra plotted as blue lines and the photometry as blue squares. The gray lines indicate the spectral uncertainties. The orange dashed lines mark the Balmer-limit wavelengths, and the blue dashed lines indicate the inflection-point wavelengths. The bottom panel shows the Hβ [O III]λλ 4960, 5008 and Hα line profiles, with the red curves denoting the best-fit total models and the dashed lines representing the best-fit individual components.
Other Images in This Article
Show More
Copyright and Terms & Conditions
© 2026. The Author(s). Published by the American Astronomical Society.

Copyright ©
2026 Astronomy Image Explorer. All Rights Reserved.
