

Image Details
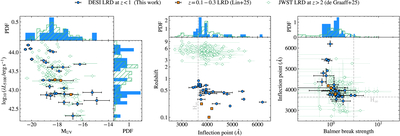
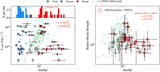
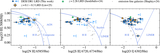
Caption: Figure 4.
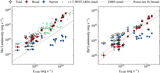
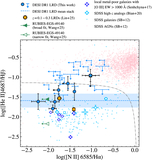
Left: the distribution of L5100 and MUV of LRDs across cosmic time. Middle: the distribution of V-shaped SED inflection points in LRDs. Right: the distribution of inflection points and Balmer break strengths. In each panel, LRDs at z < 1 from DESI DR1 are shown as blue circles. Local LRDs at z = 0.1–0.3 in Paper I are orange squares, and JWST-discovered LRDs at z > 2 (A. de Graaff et al. 2025a) are green. In the histogram, blue bars show the DESI DR1 LRD distribution, while green bars indicate JWST LRDs at z > 2. In the middle and right panels, the wavelengths of the Balmer limit are marked with gray dashed lines. In the right panel, we also include a gray dashed vertical line indicating a Balmer break strength of 3, the maximum expected for a dust-free stellar population.
Other Images in This Article
Show More
Copyright and Terms & Conditions
© 2026. The Author(s). Published by the American Astronomical Society.

