

Image Details
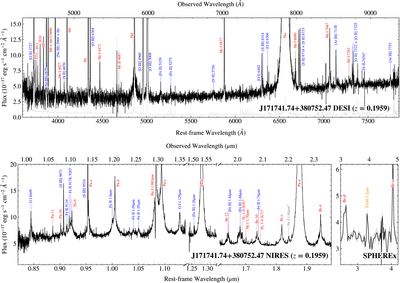
Caption: Figure 3.
Zoomed-in view of the DESI, Keck/NIRES, and SPHEREx spectra of J171741.74+380752.47. The spectra are shown as black lines, and the uncertainties are indicated by gray dotted lines or shaded regions. Emission lines are labeled.
Other Images in This Article
Show More
Copyright and Terms & Conditions
© 2026. The Author(s). Published by the American Astronomical Society.

Copyright ©
2026 Astronomy Image Explorer. All Rights Reserved.
