

Image Details
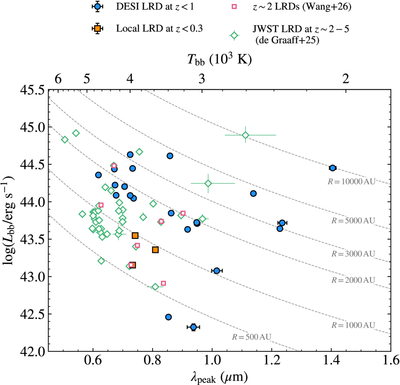
Caption: Figure 16.
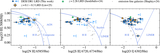
Hertzsprung–Russell (H-R) diagram of LRDs: the peak wavelength (λpeak) of the optical-to-near-infrared, blackbody-like continuum as a function of its luminosity (Lbb). The top axis indicates the effective temperature of a blackbody peaking at λpeak, based on Wien’s displacement law. Dashed gray lines mark loci of constant blackbody radius (in astronomical units), derived by combining Lbb = 4πR2σT4 with the Stefan–Boltzmann law. The JWST LRD sample is compiled from A. de Graaff et al. (2025a) and B. Wang et al. (2026).
Other Images in This Article
Show More
Copyright and Terms & Conditions
© 2026. The Author(s). Published by the American Astronomical Society.

Copyright ©
2026 Astronomy Image Explorer. All Rights Reserved.
