

Image Details
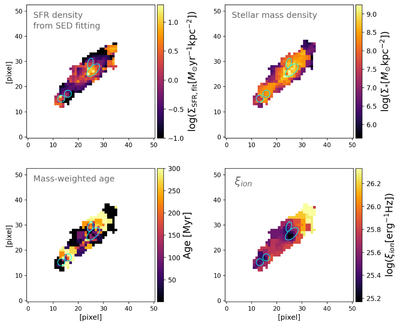
Caption: Figure 8.
Physical property maps of the star-forming clumps (1 and 2) and part of the arc that is covered within the NIRSpec IFU FoV, including the star cluster images of 3a and 4a. The apertures of the clumps 1, 2, 3a, and 4a are shown by the cyan ellipses and circles. The stellar population properties are derived directly from the resolved spectrophotometric SED fitting with PIXEDFIT, while the ionizing photon production efficiency (ξion; bottom-right panel) is derived from the Hα and UV luminosity (see Section 5.3). The cyan apertures are identical to those used to measure the photometry of clumps 1 and 2, as well as cluster images 3a and 4a (see Figure A1 in Appendix A).
Other Images in This Article
Show More
Copyright and Terms & Conditions
© 2026. The Author(s). Published by the American Astronomical Society.

