

Image Details
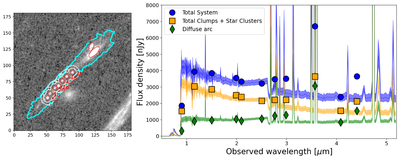
Caption: Figure A1.
Aperture photometry of the clumps (1 and 2), star cluster images, and the surrounding diffuse arc. The left panel shows the apertures used for measuring the photometry (red circles and ellipses) and the background flux from the host’s diffuse arc. The right panel shows the derived SEDs and their best-fit model spectra for the diffuse arc (green), the total SED of the clumps and star cluster images (orange), and the total SED of the whole system (blue).
Other Images in This Article
Show More
Copyright and Terms & Conditions
© 2026. The Author(s). Published by the American Astronomical Society.

Copyright ©
2026 Astronomy Image Explorer. All Rights Reserved.
