

Image Details
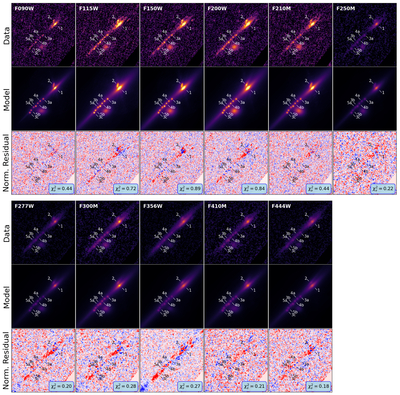
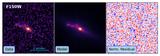
Caption: Figure 3.
Results of morphological modeling using GALFIT applied to 11-band NIRCam images in their native resolutions. In each column, the rows from top to bottom show data, best-fit model, and normalized residual images. The latter is the residual divided by the error image (σ). In the modeling, the galaxy is decomposed into ten components: the diffuse light of the host galaxy underlying the arc (i.e., tail), two bright clumps, and seven compact sources associated with the multiple images of the star clusters. In the normalized residual images, red, white, and blue colors are for positive, zero, and negative values, respectively. The reduced chi-square (﹩{\chi }_{\nu }^{2}﹩) values are shown in the bottom-right corner of the residual maps.
Other Images in This Article
Show More
Copyright and Terms & Conditions
© 2026. The Author(s). Published by the American Astronomical Society.

