

Image Details
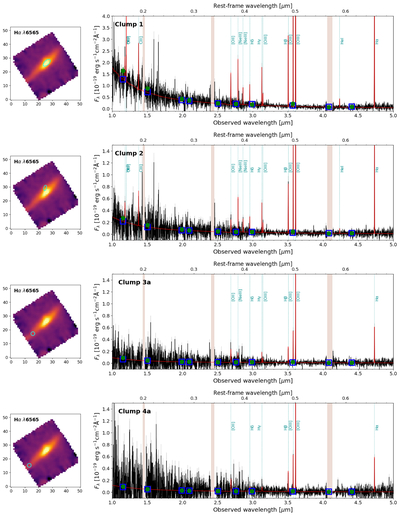
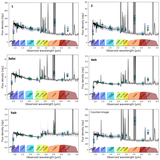
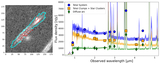
Caption: Figure 5.
Spectrophotometric SED fits of clumps 1 and 2, and star clusters 3a and 4a, obtained using PIXEDFIT. Left panel: Hα map obtained by integrating the NIRSpec IFU data cube ± 15 Å around the line’s wavelength. Right panel: spectrophotometric SED fits. The black and red spectra represent the observed and best-fit model spectra, respectively, while the green circles and blue open squares show the corresponding observed and best-fit model photometry. The vertical dashed cyan lines indicate the detected emission lines: HeII λ1640, C III] λλ1907,1909, [O II] λλ3726,3729, [Ne III] λ3870, [Ne III] λ3969, Hδ, Hγ, [O III] λ4363, Hβ, [O III] λ4959, [O III] λ5007, HeI λ5877, and Hα. The emission lines are fitted with a single Gaussian profile. The vertical shaded regions indicate the gaps between the detector chips. The cyan ellipses and circles denote the apertures used for calculating the integrated spectrophotometric SEDs. The spectra presented here are empirical, as they are measured from the reduced data cube and not corrected for lensing magnification.
Other Images in This Article
Show More
Copyright and Terms & Conditions
© 2026. The Author(s). Published by the American Astronomical Society.

