

Image Details
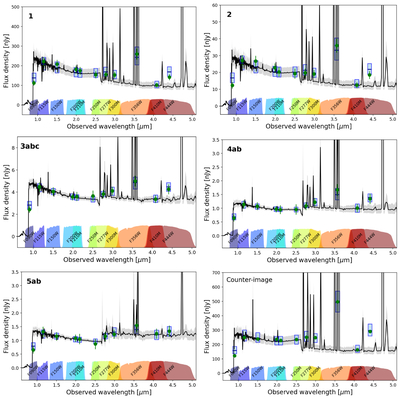
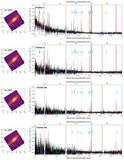
Caption: Figure 4.
Results of the SED fitting for the clumps, star clusters (using stacked photometry), and the CI, performed with BAGPIPES. All the SEDs presented here are corrected for the lensing magnification. The SEDs of the star clusters (3, 4, and 5) are obtained from stacking the delensed photometry of their multiple images. In each panel, the observed photometry is shown as green circles. The best-fit model is represented by the blue squares (photometry) and the black line (spectrum).
Other Images in This Article
Show More
Copyright and Terms & Conditions
© 2026. The Author(s). Published by the American Astronomical Society.

Copyright ©
2026 Astronomy Image Explorer. All Rights Reserved.
