

Image Details
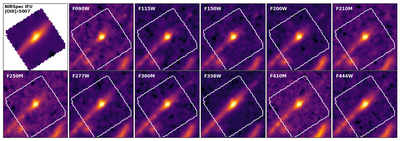
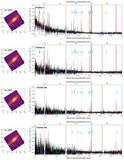
Caption: Figure 2.
Spectrophotometric data cube constructed by combining NIRCam imaging and NIRSpec IFU data using PIXEDFIT. This data cube is used only for spatially resolved SED fitting of the clumps, and not for aperture photometry and morphological modeling. To create the data cube, the datasets were spatially and spectrally aligned through PSF matching to the spatial resolution of the longest-wavelength grid of the NIRSpec G395H/F290LP data, resampling to a pixel scale of ﹩0\mathop{.}\limits^{^{\prime\prime} }1﹩, and aligning normalization between the spectra and the photometry for consistency. The top-left panel displays the [O III]λ 5007 map, derived from the NIRSpec IFU data by integrating the spectra across a narrow (100 Å) wavelength grid centered at the emission-line wavelength. The remaining panels show the NIRCam images following spatial alignment and PSF matching to the NIRSpec IFU resolution. The IFU’s FoV is shown in the top-left panel and outlined by the white box in the other panels.
Other Images in This Article
Show More
Copyright and Terms & Conditions
© 2026. The Author(s). Published by the American Astronomical Society.

