

Image Details
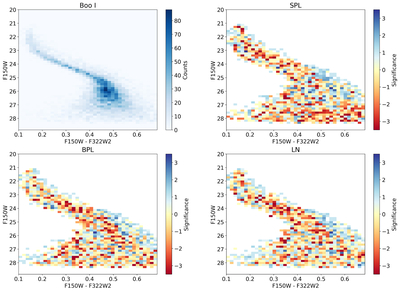
Caption: Figure 8.
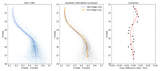
Two-dimensional histogram of the observed CMD (top-left panel). The remaining three panels show the corresponding significance maps for each model, as defined in Equation (9). The maps are displayed using a diverging colormap: yellow indicates good agreement, blue regions indicate bins where the observed CMD contains more stars, and red regions indicate bins where the posterior CMD contains more stars.
Other Images in This Article
Show More
Copyright and Terms & Conditions
© 2026. The Author(s). Published by the American Astronomical Society.

Copyright ©
2026 Astronomy Image Explorer. All Rights Reserved.
