

Image Details
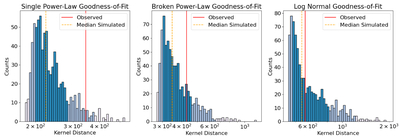
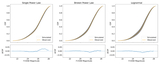
Caption: Figure 9.
Goodness-of-fit measurements for each IMF model. The histogram colors indicate the 68%, 95%, and 99% CIs of ﹩{ \mathcal D }\mathrm{post},k﹩, with the median marked by the orange dashed line. The red solid line denotes the observed value, ﹩{ \mathcal D }\mathrm{post},\mathrm{obs}﹩. The SPL model exhibits a substantially larger degree of inconsistency than the other two models.
Other Images in This Article
Show More
Copyright and Terms & Conditions
© 2026. The Author(s). Published by the American Astronomical Society.

Copyright ©
2026 Astronomy Image Explorer. All Rights Reserved.
