

Image Details
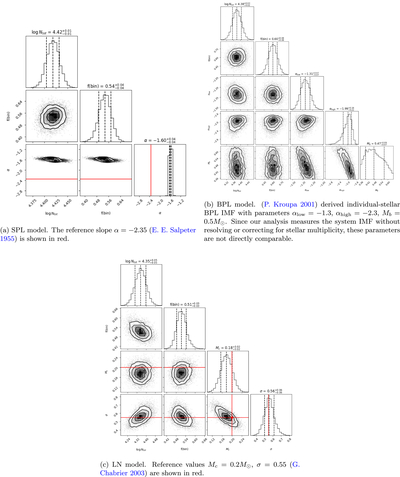
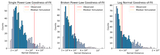
Caption: Figure 6.
Corner plots of the posterior distributions for the three IMF models, and the conditional posterior of the BPL model with Mb ∈ 0.5 ± 0.05. Vertical dashed lines indicate the 16th, 50th, and 84th percentiles of the marginal distributions. Red lines denote reference measurements from the solar neighborhood if available.
Other Images in This Article
Show More
Copyright and Terms & Conditions
© 2026. The Author(s). Published by the American Astronomical Society.

Copyright ©
2026 Astronomy Image Explorer. All Rights Reserved.
