

Image Details
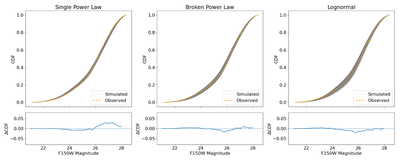
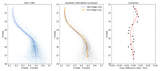
Caption: Figure 7.
Cumulative luminosity function of observed stars (orange dashed line) compared to posterior synthetic CMDs (gray lines). The synthetic samples represent 1000 realizations drawn from the posterior parameter distributions. The lower panels show the corresponding differences in cumulative distribution functions: ΔCDF = (observed CDF) − (mean of simulated CDFs).
Other Images in This Article
Show More
Copyright and Terms & Conditions
© 2026. The Author(s). Published by the American Astronomical Society.

Copyright ©
2026 Astronomy Image Explorer. All Rights Reserved.
