

Image Details
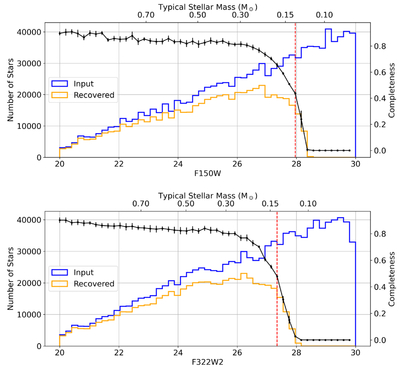
Caption: Figure 3.
Luminosity function of the input magnitudes (blue) and the recovered magnitudes (orange) of the artificial stars in the F150W (top) and F322W2 (bottom) filters. The ratio of these functions (black line) represents the photometric completeness as a function of magnitude, and the error bars represent the rms variation when grouping the ASTs by mosaic tiles and SW chips. Red vertical dashed lines mark the 50% completeness limits, while the top x-axis displays the corresponding typical stellar masses based on the stellar model.
Other Images in This Article
Show More
Copyright and Terms & Conditions
© 2026. The Author(s). Published by the American Astronomical Society.

Copyright ©
2026 Astronomy Image Explorer. All Rights Reserved.
