

Image Details
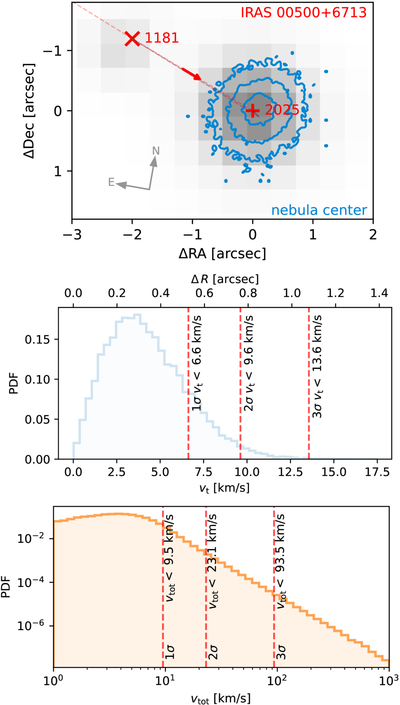
Caption: Figure 4.
Top: in gray, we show a cutout of the same [S II] GMOS image from Figure 1, focused within a few arcseconds of the central star. In blue, we show the measured center of the nebula from our RHT MCMC analysis, with 1σ, 2σ, and 3σ uncertainty contours. The position of the central star, IRAS 00500+6713, at the 1181 and 2025 epochs, is shown in red. We find that the nebula center and central star show a common sky position, ruling out separations larger than 1﹩\mathop{.}\limits^{{\unicode{x02033}}}﹩1 at 3σ. Middle: distribution of transverse velocities consistent with the sky separation of the measured nebula center and the position of the central star. These analysis support a 3σ upper limit on the transverse velocity of vt < 14 km s−1. Bottom: the probability density function (PDF) for the total kick velocity, computed by propagating the posterior on transverse velocity (middle panel) under the assumption of equal probability for all kick trajectories in 3D space.
Other Images in This Article
Copyright and Terms & Conditions
© 2026. The Author(s). Published by the American Astronomical Society.

