

Image Details
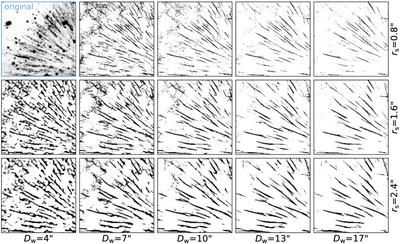
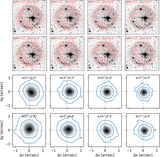
Caption: Figure A1.
The top-left panel shows the northeastern quadrant from the [S II] image shown in the top-left panel of Figure 1. The other panels depict a grid of RHTs for a range of parameters. Defined in units of pixels for the downsampled image (pixel scale = 5 × 0.08 = 0﹩\mathop{.}\limits^{{\unicode{x02033}}}﹩4), from left to right, the RHT increases in window length (Dw), and from top to bottom in the smoothing radius (rs).
Other Images in This Article
Copyright and Terms & Conditions
© 2026. The Author(s). Published by the American Astronomical Society.

Copyright ©
2026 Astronomy Image Explorer. All Rights Reserved.
