

Image Details
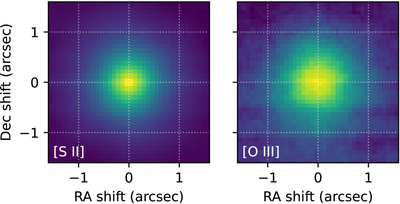
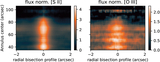
Caption: Figure B1.
Spatial cross correlation of the narrowband imaging against the output of the [S II] RHT. The left panel serves as a control and shows the cross correlation of the [S II] image and the [S II] RHT output. The right panel shows the cross correlation of the [O III] image and the [S II] RHT output. This analysis provides strong evidence that the [O III] filaments are colocated with those emitting in [S II].
Other Images in This Article
Copyright and Terms & Conditions
© 2026. The Author(s). Published by the American Astronomical Society.

Copyright ©
2026 Astronomy Image Explorer. All Rights Reserved.
