

Image Details
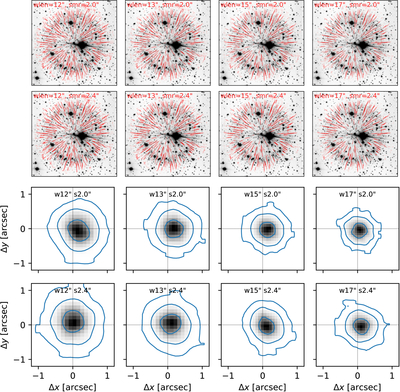
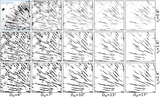
Caption: Figure C2.
Results of our analysis to determine the nebula center for different choices of RHT parameters. The upper panels show the integrated RHT intensity for every pixel in red overlaid over the [S II] image, while the lower panels show the resulting posteriors for the coordinates of the nebula center. The upper and lower rows show the results for rs = 2″ and 2﹩\mathop{.}\limits^{{\unicode{x02033}}}﹩4 respectively, while the columns, from left to right, are for Dw = 12″, 13″, 15″, and 17″, respectively.
Other Images in This Article
Copyright and Terms & Conditions
© 2026. The Author(s). Published by the American Astronomical Society.

Copyright ©
2026 Astronomy Image Explorer. All Rights Reserved.
