

Image Details
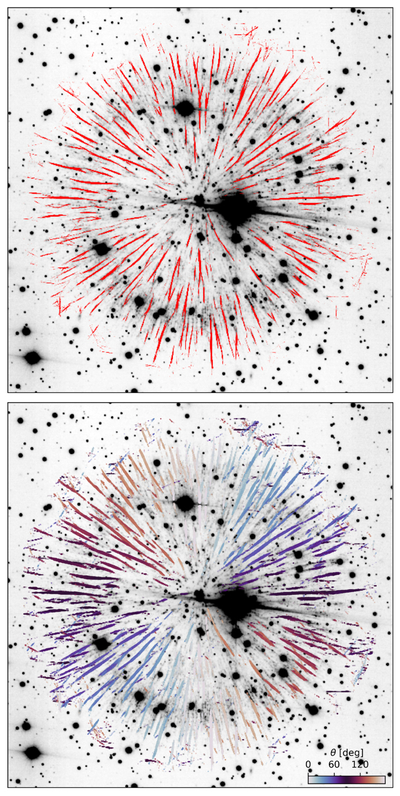
Caption: Figure 3.
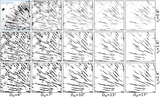
In gray scale, we show the [S II] image, smoothed to 0﹩\mathop{.}\limits^{{\unicode{x02033}}}﹩4, marginally below the seeing (0﹩\mathop{.}\limits^{{\unicode{x02033}}}﹩5). Upper panel: in red, we overlay the integrated RHT intensity for every pixel from an RHT analysis with parameters Dw = 15″, rs = 2″, and Z = 0.7. We plot the RHT intensities only up to 90″ from the central star, excluding four masking regions which were selected to avoid prominent diffraction spikes from two heavily saturated stars. Lower panel: the same RHT map as in the upper panel, but here the color of each pixel reflects the angle corresponding to the maximum intensity in the RHT spectrum. We can see that the RHT recovers the directionality of each filament.
Other Images in This Article
Copyright and Terms & Conditions
© 2026. The Author(s). Published by the American Astronomical Society.

