

Image Details
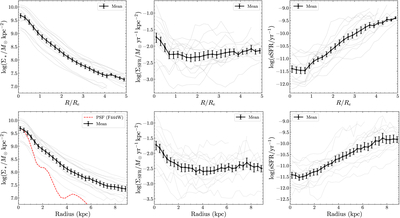
Caption: Figure 8.
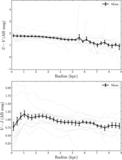
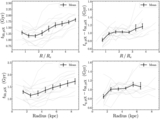
Mean radial profiles for the stellar mass, SFR, and sSFR for our sample of 14 galaxies. The top panels show the profiles normalized by the half-mass radius (Re), following R. Laishram et al. (2026). The bottom panels show the profiles with the radius R in increments of 0.3 kpc for direct comparison with N. S. Haryana et al. (2025). Left: stellar mass radial profiles. Middle: SFR radial profiles. Right: sSFR radial profiles. The red dashed line in the stellar mass radial profile plot in the bottom panel is the PSF profile for the F444W filter, which is the reference filter for the PSF matching. We can observe the increasing sSFR gradient, which indicates inside-out quenching. The error bars are the 68% confidence intervals of the mean, derived from bootstrapping for 1000 iterations.
Other Images in This Article
Show More
Copyright and Terms & Conditions
© 2026. The Author(s). Published by the American Astronomical Society.

