

Image Details
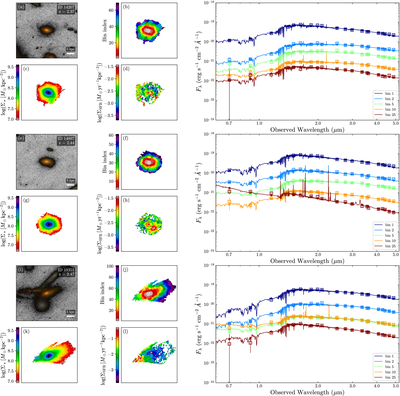
Caption: Figure 7.
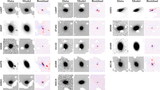
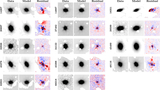
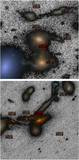
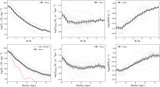
Figures (a), (e), and (i) are the RGB images (using F115W, F150W, and F200W filters), (b), (f), and (j) are the bin index maps, (c), (g), and (k) are the pixel-level stellar mass maps, and (d), (h), and (l) are the pixel-level SFR maps for the three interacting galaxies in our sample (ID_DR3 = 14207, 14897, and 18351). The spectra of different bins for these three galaxies are shown in the figures on the right. Filled circles are the model fluxes, and the open squares are the observed fluxes, with error bars. The solid lines are the best-fit SEDs for each bin.
Other Images in This Article
Show More
Copyright and Terms & Conditions
© 2026. The Author(s). Published by the American Astronomical Society.

Copyright ©
2026 Astronomy Image Explorer. All Rights Reserved.
