

Image Details
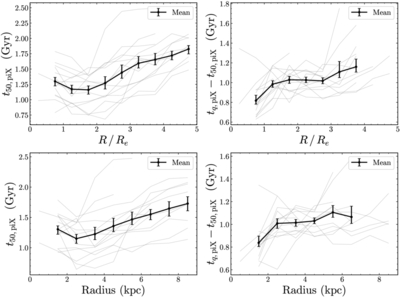
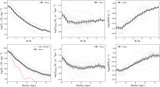
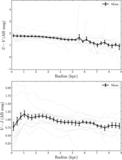
Caption: Figure 10.
Mean radial profiles of the formation time (t50, piX, on the left) and the quenching timescale (tq, piX − t50, piX, on the right) for our sample of 14 galaxies. The top panels show the profile normalized by the half-mass radius (Re) in bins of 0.5Re, while the bottom panels show the profile with radius in kiloparsecs in bins of 1 kpc. The error bars are the 68% confidence intervals of the mean, derived from bootstrapping for 1000 iterations. The positive gradient of the formation time profile indicates that the inner regions (<4 kpc) of the galaxies formed earlier than the outer regions (>4 kpc) by ≈0.5 Gyr, whereas the quenching timescale profile implies that the cores were quenched faster than the outer regions.
Other Images in This Article
Show More
Copyright and Terms & Conditions
© 2026. The Author(s). Published by the American Astronomical Society.

