

Image Details
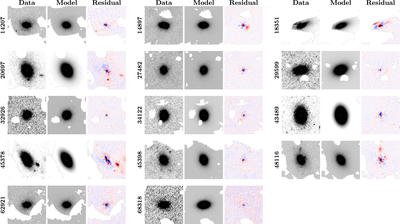
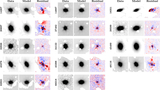
Caption: Figure 4.
Two-component pysersic fits for the galaxies in our sample in the F200W filter (4″ cutouts). The panels display the original images, the median models, and the resulting residual maps. The color scale limits (vmin and vmax) for the residual plots are set to ±0.1 (in 10 nJy), where blue regions indicate less flux than the model and red regions indicate excess flux. The average absolute residual is 4.16% ± 1.39%, with values ranging from 0.38% to 22.09%. The standard deviation of the mean is calculated via bootstrapping for 1000 iterations.
Other Images in This Article
Show More
Copyright and Terms & Conditions
© 2026. The Author(s). Published by the American Astronomical Society.

Copyright ©
2026 Astronomy Image Explorer. All Rights Reserved.
