

Image Details
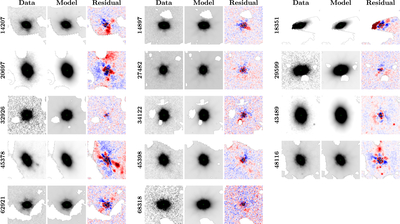
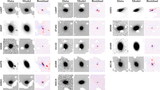
Caption: Figure 5.
Two-component pysersic fits for the galaxies in our sample in the F444W filter (4″ cutouts). The panels display the original images, the best-fit models, and the resulting residual maps. The color scale limits (vmin and vmax) for the residual plots are set to ±0.1 (in 10 nJy), where blue regions indicate less flux than the model and red regions indicate excess flux. The average absolute residual is 1.48% ± 0.67%, with values ranging from 0.16% to 10.25%. The standard deviation of the mean is calculated via bootstrapping for 1000 iterations.
Other Images in This Article
Show More
Copyright and Terms & Conditions
© 2026. The Author(s). Published by the American Astronomical Society.

Copyright ©
2026 Astronomy Image Explorer. All Rights Reserved.
