

Image Details
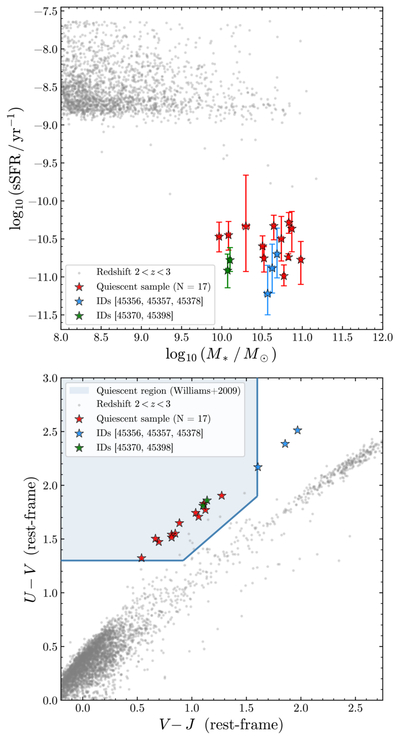
Caption: Figure 2.
The stellar mass vs. sSFR (in log scale, top panel) and UVJ diagram (bottom panel) for our sample of 17 massive quiescent galaxies out of all the galaxies in the survey with redshifts between two and three. The quiescent selection boundary from R. J. Williams et al. (2009) is shown in the UVJ plot, as a light-blue shaded region. The stellar mass vs. sSFR plot shows that our sample galaxies lie well below the star-forming galaxies, consistent with their quiescent nature. The three multiply lensed images of the first source (ID_DR3 = 45356, 45357, and 45378) are marked with blue stars, and the two multiply lensed images of the second source (ID_DR3 = 45370 and 45398) are marked with green stars. The gray points represent high-redshift galaxies in the redshift range 2 < z < 4 in the UNCOVER survey.
Other Images in This Article
Show More
Copyright and Terms & Conditions
© 2026. The Author(s). Published by the American Astronomical Society.

