

Image Details
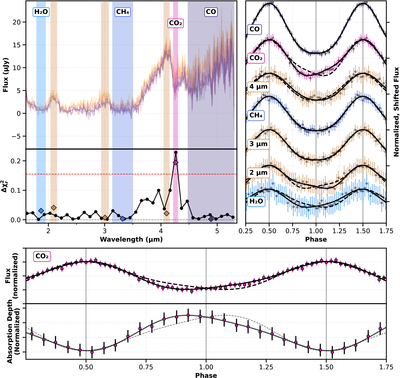
Caption: Figure 16.
An overview of the observational detections of an asymmetric CO2 absorption feature. The top-left panel shows the phase-resolved absorption spectra from 1.6 to 5.3 μm, with highlighted regions corresponding to molecular absorption features and continuum regions. The phase curves for these regions are plotted in the upper-right panel. Each phase curve is shown with the best-fitting phase-curve model (as discussed in Sections 3.4 and 3.5) as well the model reflected across the phase = 0.5 (the substellar point). The middle-left panel shows the difference in the chi-squared values of the original and reflected model fits. The red dashed line represents the threshold for a significant detection. Only the 4.2 μm CO2 feature exceeds this threshold. The lower panels show the light curve of the CO2 feature (above) and the depth of the absorption feature as a function of phase (below). Both panels show a western nightside offset that occurs ∼50 minutes before the antistellar point.
Other Images in This Article
Show More
Copyright and Terms & Conditions
© 2026. The Author(s). Published by the American Astronomical Society.

