

Image Details
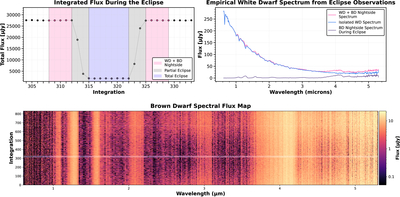
Caption: Figure 3.
Overview of the procedure to separate the white dwarf and brown dwarf emission signals. The upper-left panel shows the broadband flux around the time of the eclipse. During the total eclipse (purple), we observe the brown dwarf’s nightside emission without white dwarf contamination. Frames immediately before and after the eclipse (pink) contain combined signals from both objects. Subtracting the isolated nightside spectrum from these combined signals produces an empirical white dwarf spectrum (upper-right panel). Subtracting this white dwarf spectrum from all out-of-eclipse integrations yields isolated brown dwarf spectra for all of the integrations. The lower panel presents a two-dimensional time-series spectrum. This spectral flux map presents wavelength on the x-axis, integration number on the y-axis, and spectral flux in the color map. The eight integrations during the ingress and egress are excluded from the dataset, and are shown as white horizontal lines. For the five systematic outlier integrations, we fill in the data by linearly interpolating between the neighboring integrations.
Other Images in This Article
Show More
Copyright and Terms & Conditions
© 2026. The Author(s). Published by the American Astronomical Society.

