

Image Details
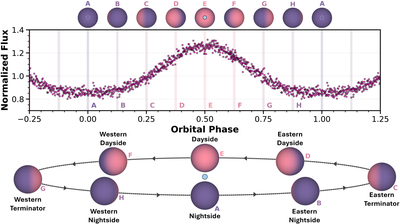
Caption: Figure 8.
Illustration of the WD–BD geometry at eight representative phases in the orbit. The upper illustrations visualize a simple representation of the brown dwarf hemisphere observed at each phase. The shading indicates how much of the dayside (pink) and nightside (purple) hemispheres are visible at each phase. In phases (A) and (E) (nightside and dayside), the smaller central circle indicates when the white dwarf is behind or in front of the brown dwarf. The center panel shows the phase-folded, broadband phase curve. The highlights indicate the amount of time used to produce each median-combined spectrum for each of the eight representative phases. Each of the eight highlighted phases is also shown in the lower orbital diagram, where the inclination is adjusted to show all phases of the orbit more clearly.
Other Images in This Article
Show More
Copyright and Terms & Conditions
© 2026. The Author(s). Published by the American Astronomical Society.

