

Image Details
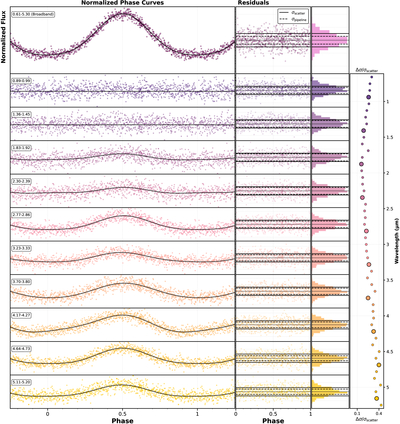
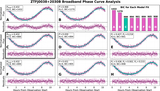
Caption: Figure 4.
The broadband phase curve and a selection of 10 spectroscopic phase curves produced for ZTF0038B (every five of the 50 evenly spaced wavelength bins). Each phase curve is fit with a second-order Fourier series with the period found from eclipse-timing analysis (Table 2). The residual columns show the phase-curve residuals as a function of phase in the center column, and a histogram of the residuals to the right. Both residual panels overlay the pipeline uncertainty (σpipeline; dashed) and observed scatter (σscatter; solid), with Δσ/σscatter quantifying the fractional excess scatter that is not accounted for by the pipeline. The rightmost panel indicates the wavelength dependence of Δσ/σscatter, and the larger markers indicate the selection of 10 spectroscopic with phase curves shown on the left.
Other Images in This Article
Show More
Copyright and Terms & Conditions
© 2026. The Author(s). Published by the American Astronomical Society.

