

Image Details
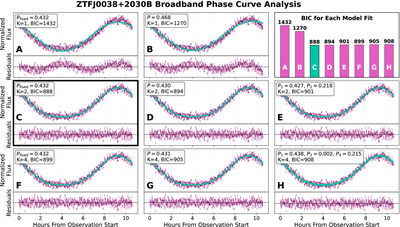
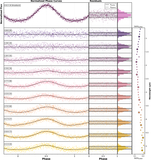
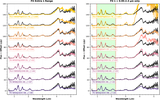
Caption: Figure 6.
Several multicomponent sinusoidal model fits of the broadband phase curve of ZTF0038B. The top row uses a single sinusoid to fit the data, and each row below adds an additional term. The first column fits the model assuming the period found in our eclipse-timing analysis (Table 2), the second column shares a single best-fit period among all terms, and the third column fits for the period of each term separately. The bar chart on the top right compares the BIC value from each model fit, and concludes that panel (C) provides the optimal phase-curve model. This consists of a two-component fit that is consistent with the period determined from our eclipse-timing analysis.
Other Images in This Article
Show More
Copyright and Terms & Conditions
© 2026. The Author(s). Published by the American Astronomical Society.

