

Image Details
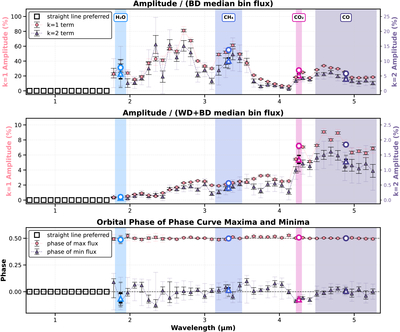
Caption: Figure 7.
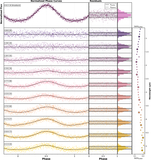
Fourier amplitudes and phases of the spectroscopic phase curves as a function of wavelength. Each phase curve is fit with a second-order Fourier series; bins consistent with a flat model are indicated with black squares. In each panel, we include the phase-curve information for 50 evenly spaced wavelength bins, as well as a few additional wavelength bins corresponding to H2O, CH4, CO2, and CO absorption features. The wavelength ranges used to make these phase curves are highlighted. The markers for these molecular absorption phase curves are bolded. All data points include black error bars corresponding to the 1σ uncertainties, and fainter gray error bars that correspond to the 3σ uncertainties. Top: phase-curve amplitudes normalized by the brown dwarf flux. The k = 1 (first-order) and k = 2 (second-order) components are shown with circular and triangular markers, respectively. Middle: the same as the top panel, except the amplitudes are normalized by the combined flux of the white dwarf and brown dwarf. Bottom: the phases corresponding to the maximum and minimum points in the phase-curve model are shown with circular and triangular markers, respectively.
(The data used to create this figure are available in the online article.)
(The data used to create this figure are available.)
Other Images in This Article
Show More
Copyright and Terms & Conditions
© 2026. The Author(s). Published by the American Astronomical Society.

