

Image Details
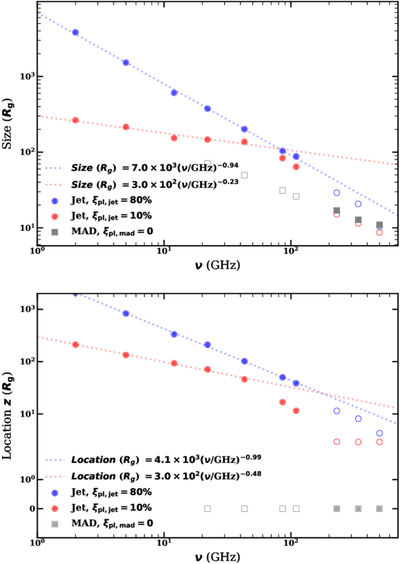
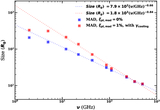
Caption: Figure 6.
The radio core size (top panel) and location (bottom panel) of LLAGNs under the MAD.th-jet model. We take ﹩{\dot{m}}_{0}=1\times 1{0}^{-4}﹩ and a M03 FP, i.e., ﹩{\dot{m}}_{{\rm{jet}}}=8.1\times 1{0}^{-7}﹩ for ξpl,jet = 80% (shown by blue circles) and ﹩{\dot{m}}_{{\rm{jet}}}=1.03\times 1{0}^{-6}﹩ for ξpl,jet = 10% (shown by red circles). The predicted radio size and location of MAD are shown by gray squares. Filled and open properties of the symbols represent whether its emission dominates or not in the total spectrum at this frequency. For completeness, the dashed lines with the same color as the symbols show the power-law fits of the jet part.
Other Images in This Article
Copyright and Terms & Conditions
© 2026. The Author(s). Published by the American Astronomical Society.

