

Image Details
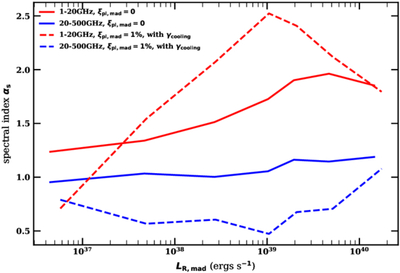
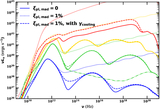
Caption: Figure 4.
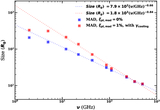
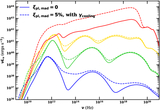
Spectral index of the radio emission of MAD αs as a function of 5 GHz radio luminosity of MAD LR,mad(caution that jet emission at this frequency is not included). The red and blue curves represent αs derived at 1–20 GHz and 20–500 GHz, respectively. The solid and the dashed properties of each curve define, respectively, the MAD.th case with ξpl,mad = 0 and the self-consistent MAD.pl (see Section 4.2) case with ξpl,mad = 1% and γcooling.
Other Images in This Article
Copyright and Terms & Conditions
© 2026. The Author(s). Published by the American Astronomical Society.

Copyright ©
2026 Astronomy Image Explorer. All Rights Reserved.
