

Image Details
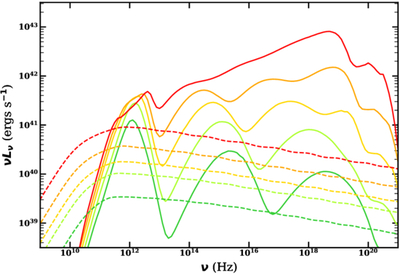
Caption: Figure 3.
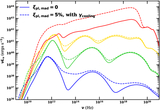
Spectrum of LLAGNs under the MAD.th-jet model (only thermal electrons in MAD, see Section 4.1). The emission from MAD.th is shown in solid curves, where, from top to bottom, are results for ﹩{\dot{m}}_{0}=1\times 1{0}^{-2}﹩, 3.16 × 10⁻³, 1 × 10⁻³, 3.16 × 10⁻⁴, 1 × 10⁻⁴, respectively. The dashed lines with the same color represent the jet emission that follows the M03 FP.
Other Images in This Article
Copyright and Terms & Conditions
© 2026. The Author(s). Published by the American Astronomical Society.

Copyright ©
2026 Astronomy Image Explorer. All Rights Reserved.
