

Image Details
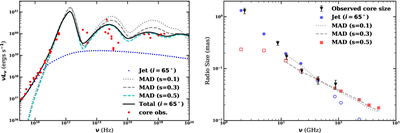
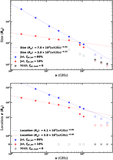
Caption: Figure 2.
Theoretical modeling of M104 under the MAD.th-jet model (“.th” represents purely thermal electrons, see Section 4.1). For simplicity, we only show cases with viewing angle i = 65°. Left panel: broadband SED. Here the red dots are gathered by X. Yan et al. (2024). The cyan dashed, the blue dotted, and the black solid lines represent emission from MAD (outflow parameter s = 0.5), jet, and MAD+jet (total), respectively. Right panel: the radio core size (note that Rg ≈ 1 × 10⁻³ mas). Here the black triangles (with error bars) are from high-resolution observations (X. Yan et al. 2024). Theoretical results from MAD and jet are shown by red squares and blue circles, respectively. For clarity, they are shown in filled or open markers, depending on their flux dominance. As can be seen from the left panel, the jet (MAD) radiation dominates below (above) ∼30–40 GHz. In both panels, we also show MAD.th calculations with s = 0.1 (gray dotted curve) and s = 0.3 (gray dashed curve), for comparison. Accretion rates are adjusted to fit the radio luminosity.
Other Images in This Article
Copyright and Terms & Conditions
© 2026. The Author(s). Published by the American Astronomical Society.

