

Image Details
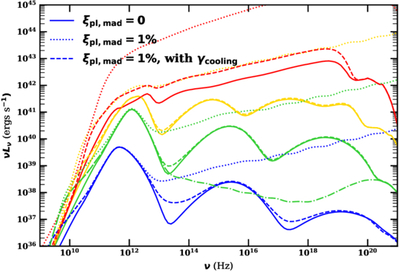
Caption: Figure 8.
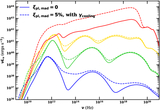
Broadband SED of MAD models under different PL electron setups. From top to bottom, lines with the same color represent MADs whose accretion rates are ﹩{\dot{m}}_{0}=1\times 1{0}^{-2}﹩, 1 × 10⁻³, 1 × 10⁻⁴, and 1 × 10⁻⁵, respectively. For each accretion rate, three PL electron setups are considered (lines with the same color), i.e., solid for the ξpl,mad = 0 (MAD.th case), dotted for the fixed distribution PL case (ξpl,mad = 1%, radiative cooling to PL electrons excluded, a νLν ∝ ν∼+0.23 spectrum is observed at ν ≳ × 1014 Hz), and dashed for the self-consistent PL case (ξpl,mad = 1%, and radiative cooling to PL electrons included). For comparative purposes, the green dotted–dashed curve shows the spectrum without inverse Compton, for the case of PL electrons with γcooling. A νLν ∝ ν∼−0.246 spectrum is indeed observed at 1014-1017 Hz. Above ∼1018 Hz is the bremsstrahlung bump.
Other Images in This Article
Copyright and Terms & Conditions
© 2026. The Author(s). Published by the American Astronomical Society.

