

Image Details
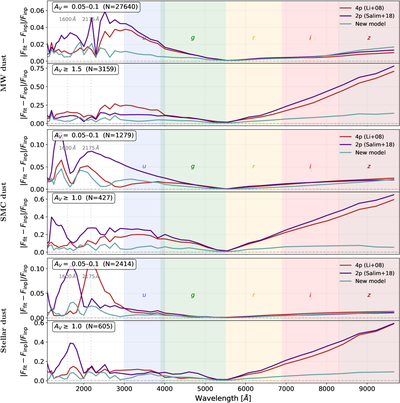
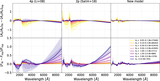
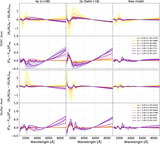
Caption: Figure 8.
Modulus of the fractional difference in recovered observed (attenuated) flux when relying on the best-fit attenuation curve from the three different functional forms explored here (see legend) for MW dust mixture (top row) and SMC dust (bottom row). Each panel shows the median across all lines of sight of galaxies within the lowest and highest AV bins in the simulated galaxy sample; the number of galaxies and range of AV values are reported in the top-left corner of the plots. The model proposed in this work achieves consistently smaller errors across AV, wavelength, and dust mixture than those from the literature.
Other Images in This Article
Show More
Copyright and Terms & Conditions
© 2026. The Author(s). Published by the American Astronomical Society.

