

Image Details
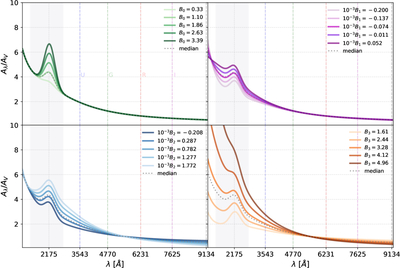
Caption: Figure 5.
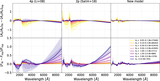
Summary plot illustrating the effect of independently varying each parameter of our new attenuation-curve model (B0, B1, B2, and B3; Equation (7)), while keeping the remaining parameters fixed at their median values. The gray dotted curve shows the median attenuation curve of the combined TNG galaxy sample, while the colored curves illustrate the impact of varying a single parameter across its central percentile range. The parameters primarily regulate the UV bump strength (B0; top left), the FUV slope (B1; top right), the curvature of the UV-to-optical transition region (B2; bottom left), and the large-scale UV-to-optical slope (B3; bottom right). The vertical colored lines indicate the central wavelengths of the Sloan Digital Sky Survey (SDSS) filters (u, g, r, i, z), while the gray shaded region highlights the wavelength coverage of the GALEX bands.
Other Images in This Article
Show More
Copyright and Terms & Conditions
© 2026. The Author(s). Published by the American Astronomical Society.

