

Image Details
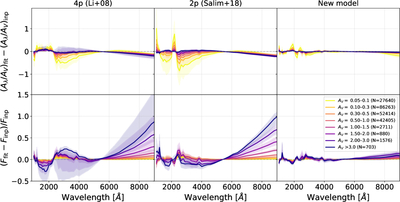
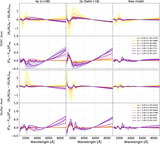
Caption: Figure 7.
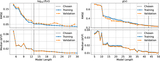
Residuals in the normalized attenuation curve (top row) and fractional flux error (bottom row) for the three parameterizations: A. Li et al. (2008) (four parameters), S. Salim et al. (2018) (two parameters), and the new model (shown left to right), all adopting the fiducial MW dust mixture. For each galaxy and line of sight, the deviation between the best-fit and input attenuation curve is computed individually; the results are then binned by the line-of-sight AV. Solid lines show the median within each AV bin, and shaded bands span the 30th–70th percentile range. The number of (galaxy, line-of-sight) pairs in each bin is indicated in the legend.
Other Images in This Article
Show More
Copyright and Terms & Conditions
© 2026. The Author(s). Published by the American Astronomical Society.

