

Image Details
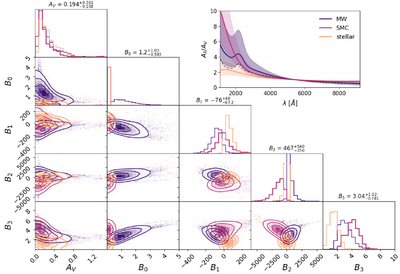
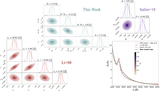
Caption: Figure 10.
Corner plot of the best-fit parameters of our attenuation-curve model (Equation (7)) for the 487 galaxies from TNG50 and TNG100, each sampled along 51 lines of sight and fitted assuming three dust mixtures (MW, SMC, and stellar dust). Colors indicate different dust compositions. The inset shows the corresponding median attenuation curves, with shaded regions indicating the 16th–84th percentile range. For reference, the observed MW (J. A. Cardelli et al. 1989) and SMC (M. Prevot et al. 1984) extinction curves are also shown (black dashed and gray dotted lines, respectively). This comparison illustrates the impact of dust composition on both the best-fit parameter distributions and the resulting attenuation-curve shapes.
Other Images in This Article
Show More
Copyright and Terms & Conditions
© 2026. The Author(s). Published by the American Astronomical Society.

