

Image Details
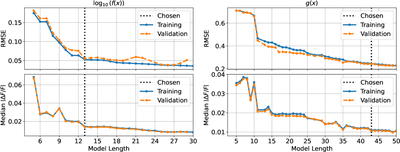
Caption: Figure 4.
Pareto front (equations minimizing RMSE for a given model length) of solutions found with OPERON for (left) the outer part of the attenuation curve, ﹩{\mathrm{log}}_{10}(f(x))﹩, and (right) the bump region of the attenuation curve, g(x). On the top, we plot the root mean-squared error (RMSE) on the target variable, and on the bottom, we plot the corresponding median absolute fractional error on the corresponding flux, ΔF/F. We plot the training and validation sets separately, and the vertical lines indicate our chosen models.
Other Images in This Article
Show More
Copyright and Terms & Conditions
© 2026. The Author(s). Published by the American Astronomical Society.

Copyright ©
2026 Astronomy Image Explorer. All Rights Reserved.
