

Image Details
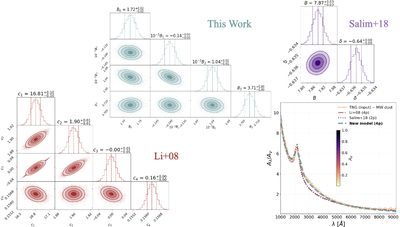
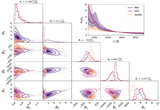
Caption: Figure 6.
Posterior distributions of the best-fit parameters obtained by fitting the attenuation curve of a reference TNG50 galaxy (id 42) along a randomly selected line of sight (los 27). We show results using the four-parameter model of A. Li et al. (2008) (red), the two-parameter model of S. Salim et al. (2018) (purple), and our new symbolic-regression-based functional form (teal). The bottom-right panel shows the input synthetic attenuation curve from the simulation (orange solid line) against the best-fit curve obtained with each parameterization in the respective color. Our model fits the attenuation curve the best, and the posterior distribution of the inferred parameters is less correlated than that of the A. Li et al. (2008) model.
Other Images in This Article
Show More
Copyright and Terms & Conditions
© 2026. The Author(s). Published by the American Astronomical Society.

