

Image Details
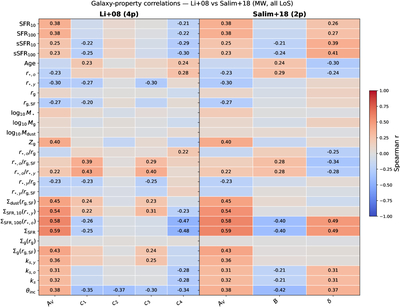
Caption: Figure A1.
Correlation matrices between attenuation-curve parameters and galaxy properties for the A. Li et al. (2008) and S. Salim et al. (2018) parameterizations, computed using all lines of sight and assuming MW dust. Values of the Spearman correlation coefficient, r, obeying r < 0.2 are not printed for clarity. Compared to our new parameterization, these models exhibit a lower fraction of significant correlations and a less structured mapping onto galaxy properties, highlighting the improved interpretability and physical connection enabled by our functional form.
Other Images in This Article
Show More
Copyright and Terms & Conditions
© 2026. The Author(s). Published by the American Astronomical Society.

Copyright ©
2026 Astronomy Image Explorer. All Rights Reserved.
