

Image Details
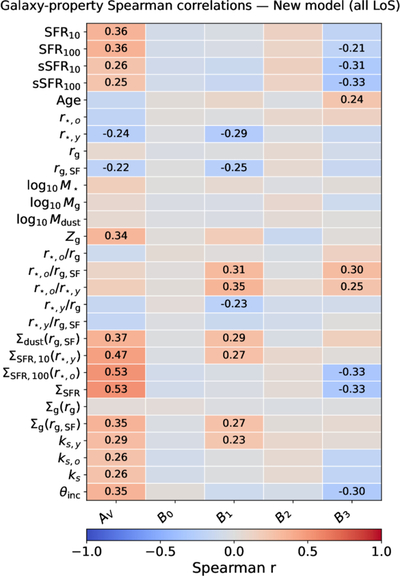
Caption: Figure 12.
Correlation matrices between attenuation-curve parameters and galaxy properties for our new parameterization, computed using all lines of sight. Here we show the case where attenuation curves from different dust mixtures are combined and treated as additional lines of sight, and in Figure A2 we separate the dust mixtures. For clarity, we only print Spearman correlation coefficients, r, that satisfy ∣r∣ ≥ 0.2. The overall structure of the correlations is preserved across dust mixtures, with AV and ΣSFR remaining the dominant drivers. Combining dust mixtures introduces additional scatter that erases correlations involving bump-related parameters.
Other Images in This Article
Show More
Copyright and Terms & Conditions
© 2026. The Author(s). Published by the American Astronomical Society.

